
More help:
NWEA Support
Have an idea?
Share it!
Term Summary Report
| Description | The Term Summary report provides aggregate and detailed domain-specific data for Benchmark tests and the Dyslexia Screener. The report offers interactive data visualizations for performance levels of Science of Reading domains and sub-scores to support instructional differentiation decisions. |
| Intended audience | Administrators and Instructors |
| Required role |
Instructor, School Administrator, and District Administrator* *The District Administrator role has access to aggregate data only and cannot access detailed student results from the Term Summary report. |
Learn more about the Term Summary report by exploring each section below:
Getting Started
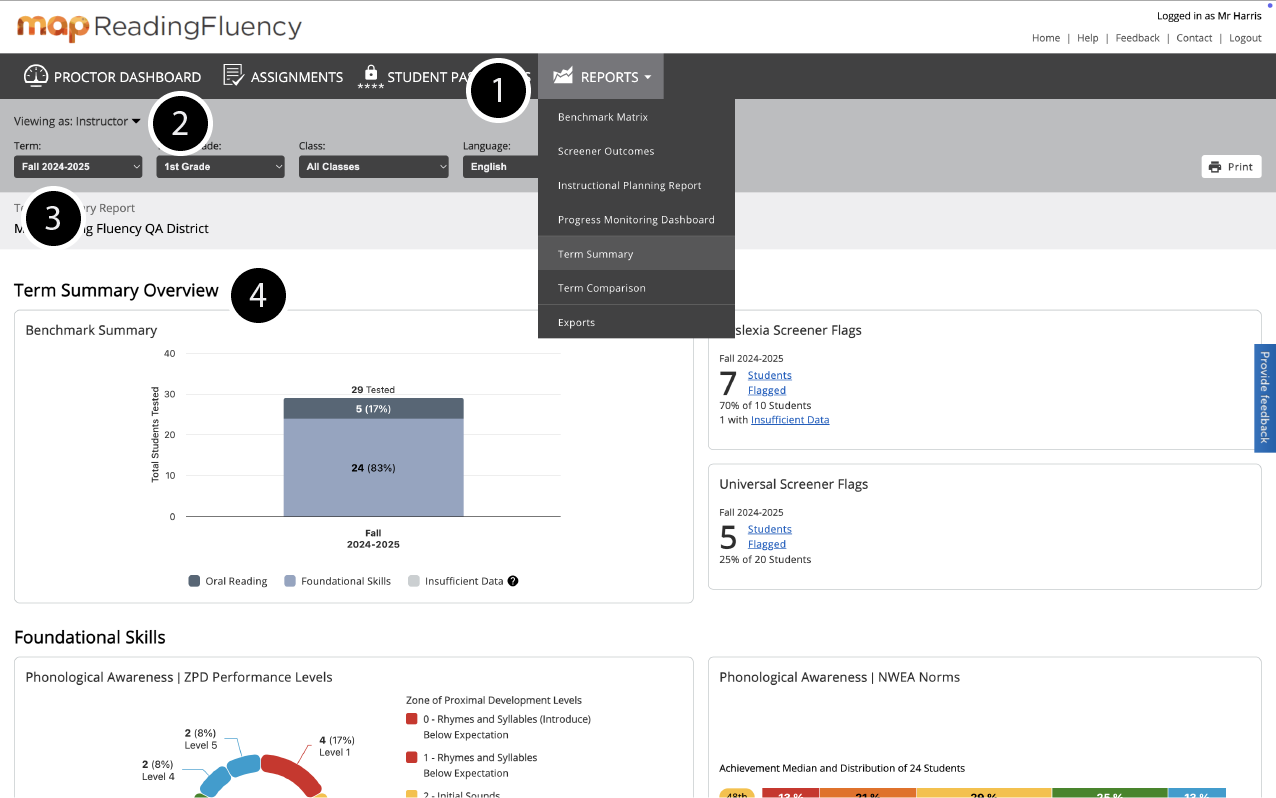
This annotated graphic will guide you through accessing the report. Use the numbered steps to get started.
-
In MAP Reading Fluency, select REPORTS on the dark gray menu bar toward the top of the screen, then choose Term Summary Report from the drop-down menu.
-
Adjust your role as needed.
-
To access data from a specific Term, School, Grade, or Language, adjust the high-level filters as needed. Please note the following specifications and special cases:
-
Data is only available from the current term to the previous two years.
-
Only the Instructor and School Administrator roles can adjust the Class filter.
-
The District Administrator role can view data from individual schools as well as all schools at once.
-
-
Review results.
Data Considerations
As you explore the charts throughout the Term Summary report, keep in mind the following data considerations:
-
Each student’s strongest scores are represented.
-
If a student has reportable data from both Foundational Skills and Oral Reading measures, their results will appear only in the Oral Reading section of the report.
-
If a student has multiple screener outcomes from the same screener and received both not-flagged and flagged outcomes from the screener, they will not be counted in the screener’s flagged section of the report.
-
If a student has multiple tests results within a domain, their best results are shown for each measure, even if those results draw from different tests throughout the report.
-
Percentages are rounded to the nearest integer. This may result in percentage sums that are slightly higher or lower than 100%.
Term Summary Overview
This section of the Term Summery report offers a high-level overview of your students’ data.
Benchmark Summary
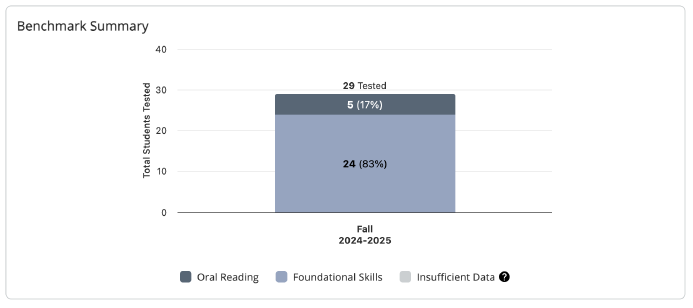
This graph provides a breakdown of results for all students represented in the Term Summary report. Each student is accounted for in the breakdown only once, according to their best results. For example, if a student has scores in both Foundational Skills and Oral Reading, they are counted in Oral Reading. A student is counted in the Insufficient Data category if they’ve only been assigned Oral Reading tests and they have not produced reportable data.
You can select any segment of the graph to find the list of students counted within that section.
Dyslexia Screener Flags
This section reports the number of students whose best results produced a Dyslexia Screener flag outcome. If a student hasn’t answered enough questions on the Dyslexia Screener to receive a score, their results are considered Insufficient Data in this section.
You can select any of the hyperlinked text to find the list of students counted within that section.

Universal Screener Flags
This section reports the number of students whose best results produced a Universal Screener flag outcome. If a student hasn’t answered enough questions on their assigned test(s) to receive a score, their results are considered Insufficient Data in this section.
You can select any of the hyperlinked text to find the list of students counted within that section.

Foundational Skills
This section of the Term Summary report represents data for students whose results are counted in the Foundational Skills portion of the Benchmark Summary breakdown.
If a student counted in this section has multiple tests with Foundational Skills results, their best results are shown for each chart. For example, if a student has results from two different tests, the student’s strongest scores for each domain will be represented—even if those scores draw from the two different tests throughout the Foundational Skills section.
Phonological Awareness | ZPD Performance Levels
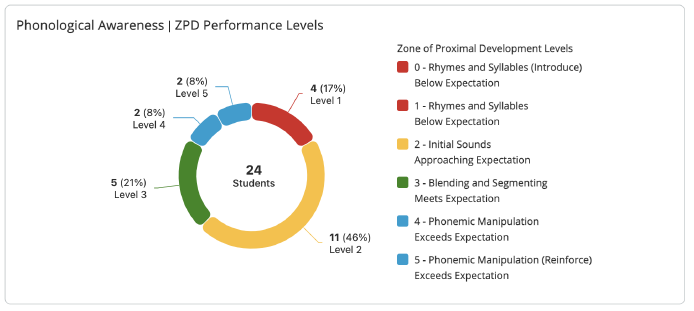
This chart represents student performance in Phonological Awareness according to ZPD performance levels.
The number of students counted in the Foundational Skills section is shown in the center of a pie chart as a local total. Each surrounding band of the pie chart lists the number of students within the represented ZPD level, along with a corresponding percentage of the local total.
The color of each ZPD level corresponds to grade-level expectations and will vary by grade and term. For more information about ZPDs and grade-level expectations for performance levels, see Zone of proximal development levels and Phonological Awareness and Phonics & Word Recognition.
Select any pie chart segment to see a list of those students.
Phonological Awareness | NWEA Norms
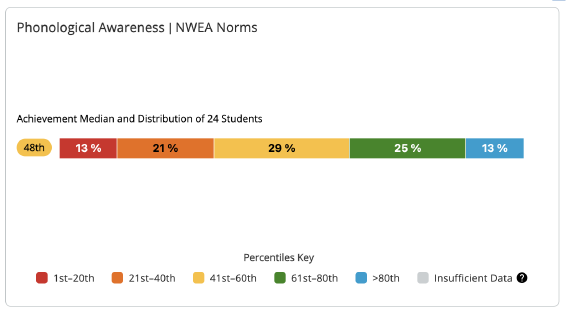
This chart represents student performance in Phonological Awareness based on NWEA user norms.
The number of students counted in the Foundational Skills section is listed as a local total above the visualization. From the results of this local total, the median percentile is represented in a colorful pill shape next to an achievement percentile distribution. Each band of the distribution displays a percentage of the local total arranged into quintiles (five percentile levels based on NWEA normative data). A section for Insufficient Data is also included for performance that fails to produce a domain score. For more information about NWEA user norms, see the report for Achievement and growth norms for English MAP Reading Fluency Foundational Skills.
Select any band from the achievement percentile distribution to see a list of those students.
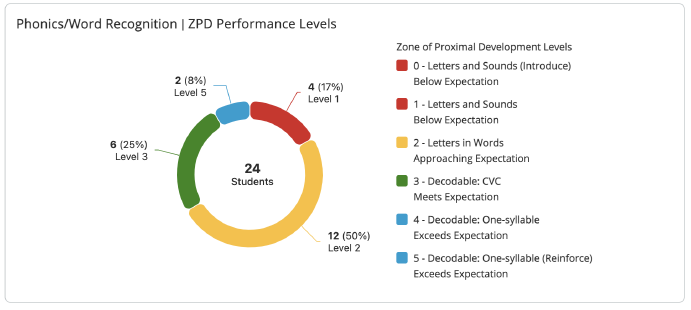
Phonics/Word Recognition | ZPD Performance Levels
This chart represents student performance in Phonics/Word Recognition according to ZPD performance levels.
The number of students counted in the Foundational Skills section is shown in the center of a pie chart as a local total. Each surrounding band of the pie chart lists the number of students within the represented ZPD level, along with a corresponding percentage of the local total.
The color of each ZPD level corresponds to grade-level expectations and will vary by grade and term. For more information about ZPDs and grade-level expectations for performance levels, see Zone of proximal development levels and Phonological Awareness and Phonics & Word Recognition.
Select any pie chart segment to see a list of those students.
[ESTEE--I changed halfway through--just copied the entire rest of the doc from here... the images came out as the text shown between the brackets above--they change to that text when you paste them over]
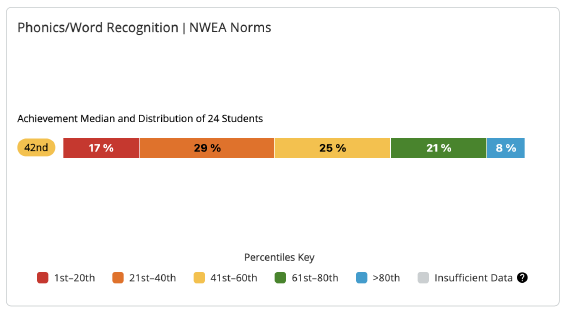
Phonics/Word Recognition | NWEA Norms
This chart represents student performance in Phonics/Word Recognition based on NWEA user norms.
The number of students counted in the Foundational Skills section is listed as a local total above the visualization. From the results of this local total, the median percentile is represented in a colorful pill shape next to an achievement percentile distribution. Each band of the distribution displays a percentage of the local total arranged into quintiles (five percentile levels based on NWEA normative data). A section for Insufficient Data is also included for performance that fails to produce a domain score. For more information about NWEA user norms, see the report for Achievement and growth norms for English MAP Reading Fluency Foundational Skills.
Select any band from the achievement percentile distribution to see a list of those students.
Language Comprehension | NWEA Norms
This chart represents student performance in Language Comprehension based on NWEA user norms.
The number of students counted in the Foundational Skills section is listed as a local total above the visualization. From the results of this local total, the median percentile is represented in a colorful pill shape next to an achievement percentile distribution. Each band of the distribution displays a percentage of the local total arranged into quintiles (five percentile levels based on NWEA normative data). A section for Insufficient Data is also included for performance that fails to produce a domain score. For more information about NWEA user norms, see the report for Achievement and growth norms for English MAP Reading Fluency Foundational Skills.
Select any band from the achievement percentile distribution to see a list of those students.

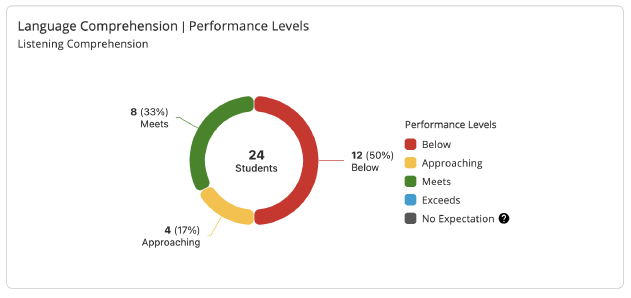
Listening Comprehension | Performance Levels
This chart represents student performance in Listening Comprehension (a measure under the Language Comprehension domain) according to performance levels.
The number of students counted in the Foundational Skills section is shown in the center of a pie chart as a local total. Each surrounding band of the pie chart lists the number of students within the represented performance level, along with a corresponding percentage of the local total.
The color of each performance level corresponds to grade-level expectations and will vary by grade and term. A segment for No Expectation is also included for performance that has no associated grade-level expectations. For more information about grade-level expectations for performance levels, see Language Comprehension (Listening Comprehension and Picture Vocabulary)..
Select any pie chart segment to see a list of those students.
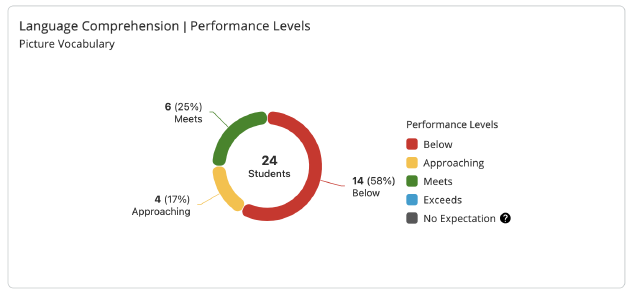
Picture Vocabulary | Performance Levels
This chart represents student performance in Picture Vocabulary (a measure under the Language Comprehension domain) according to performance levels.
The number of students counted in the Foundational Skills section is shown in the center of a pie chart as a local total. Each surrounding band of the pie chart lists the number of students within the represented performance level, along with a corresponding percentage of the local total.
The color of each performance level corresponds to grade-level expectations and will vary by grade and term. A segment for No Expectation is also included for performance that has no associated grade-level expectations. For more information about grade-level expectations for performance levels, see Language Comprehension (Listening Comprehension and Picture Vocabulary).
Select any pie chart segment to see a list of those students.
Sentence Reading Fluency
This section of the Term Summary report represents data for all students. If a student has taken multiple tests, their best results are shown, even if results from other tests are shown elsewhere in the Term Summary report.
Sentence Reading Fluency | Performance Levels
This chart represents student performance for Sentence Reading Fluency according to performance levels.
The number of students counted in the Foundational Skills section is shown in the center of a pie chart as a local total. Each surrounding band of the pie chart lists the number of students within the represented performance level, along with a corresponding percentage of the local total.
The color of each performance level corresponds to grade-level expectations and will vary by grade and term. A segment for No Expectation is also included for performance that has no associated grade-level expectations. For more information about grade-level expectations for performance levels, see Sentence Reading Fluency.
Select any pie chart segment to see a list of those students.

Oral Reading
This section of the Term Summary report represents data for students whose results are counted in the Oral Reading portion of the Benchmark Summary breakdown.
If a student counted in this section has multiple tests with Oral Reading results, their best results are shown for each chart. For example, if a student has results from two different tests, the student’s strongest scores for each domain will be represented—even if those scores draw from the two different tests throughout the Oral Reading section.
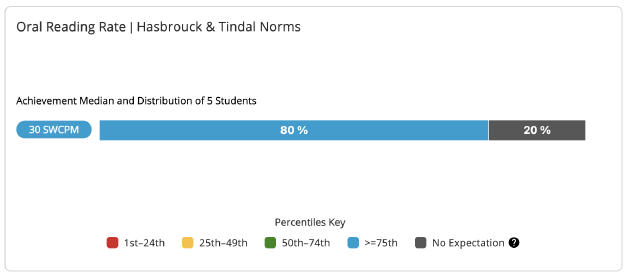
Oral Reading Rate | Hasbrouck & Tindal Norms
This chart represents student performance for Oral Reading Rate based on Hasbrouck & Tindal (2017) norms.
The number of students counted in the Oral Reading section is listed as a local total above the visualization. From the results of this local total, the median SWCPM is represented in a colorful pill shape next to an achievement percentile distribution. Each band of the distribution displays a percentage of the local total arranged into quartiles (four percentile ranges based on Hasbrouck & Tindal normative data). A segment for No Expectation is also included for performance that has no associated grade-level expectations. For more information about Hasbrouck & Tindal (2017) norms, see the English MAP Reading Fluency Technical Report.
Select any band from the achievement percentile distribution to see a list of those students.
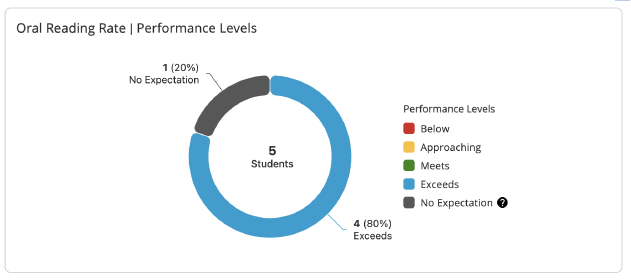
Oral Reading Rate | Performance Levels
This chart represents student performance for Oral Reading Rate according to performance levels.
The number of students counted in the Oral Reading section is shown in the center of a pie chart as a local total. Each surrounding band of the pie chart lists the number of students within the represented performance level, along with a corresponding percentage of the local total. A segment for No Expectation is also included for performance that has no associated grade-level expectations.
The color of each performance level corresponds to grade-level expectations and will vary by grade and term. For more information about grade-level expectations for Oral Reading Rate, see Words-Correct-per-Minute (WCPM) expectations.
Select any pie chart segment to see a list of those students.
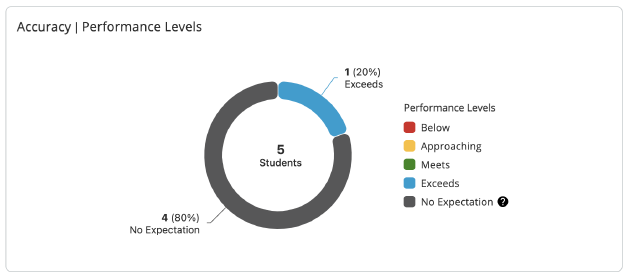
Accuracy | Performance Levels
This chart represents student performance on Accuracy according to performance levels.
The number of students counted in the Oral Reading section is shown in the center of a pie chart as a local total. Each surrounding band of the pie chart lists the number of students within the represented performance level, along with a corresponding percentage of the local total. A segment for No Expectation is also included for performance that has no associated grade-level expectations.
The color of each performance level corresponds to grade-level expectations and will vary by grade and term. For more information about grade-level expectations for Accuracy, see Oral Reading accuracy.
Select any pie chart segment to see a list of those students.
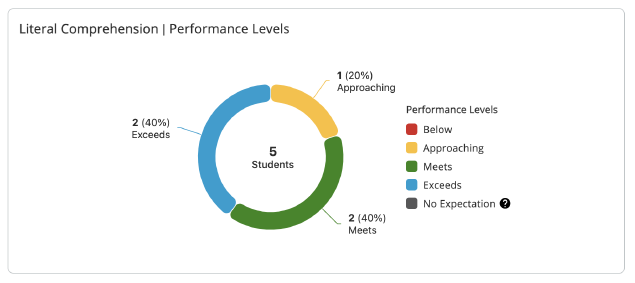
Literal Comprehension | Performance Levels
This chart represents student performance in Literal Comprehension according to performance levels.
The number of students counted in the Oral Reading section is shown in the center of a pie chart as a local total. Each surrounding band of the pie chart lists the number of students within the represented performance level, along with a corresponding percentage of the local total. A segment for No Expectation is also included for performance that has no associated grade-level expectations.
The color of each performance level corresponds to grade-level expectations and will vary by grade and term. For more information about grade-level expectations for Literal Comprehension, see the English MAP Reading Fluency Technical Report.
Select any pie chart segment to see a list of those students.
Oral Reading Rate | Distribution
This table shows the distribution of Scaled Words Correct Per Minute (SWCPM) scores.
The values are based on scores from students counted in the Oral Reading section as a local sample. For this local sample, the lowest, 25th percentile, median, 75th percentile, and highest score are listed.

Lexile® Oral Reading Measure | Distribution
This table shows the distribution of Lexile oral reading scores.
The values are based on scores from students counted in the Oral Reading section as a local sample. For this local sample, the lowest, 25th percentile, median, 75th percentile, and highest scores are listed. For more information about Lexile measures, see Using Lexile Measurements.
